Non-Emergency Medical Transportation Statistics
There is a substantial increase in the population of seniors and disabled people in the U.S., so it’s difficult to overstate the importance of non-emergency medical transportation (NEMT) in modern society. NEMT is a comprehensive medical transportation solution that supports a range of use cases and modes of transportation for the disadvantaged populations.
NEMT plays a critical role in accessing medical appointments, healthcare services, pharmacies, labs, and more. The latest non-emergency medical transportation stats show that the NEMT industry remains vital, continues to gain recognition, and keeps evolving.
See the facts below!
Contents:
- NEMT Is the Fastest-Growing Patient Transport Segment in Medical Transportation
- NEMT Services Are Important for Positive Healthcare Outcomes of Patients
- The Financial Case for NEMT: Costs, Savings, and ROI
- The United States NEMT Market Landscape
- How Many People Are Eligible vs. How Many Actually Use NEMT
- Who Uses NEMT Most (Ages, Disability, and High-Need Conditions)
- Where Do Rides "Go"?
- Rural vs. Urban NEMT Disparities
- Who is Paying for NEMT
- NEMT Mode Split: Ambulatory vs Wheelchair vs Stretcher
- What NEMT Management Models Do States Use?
- Diffusion of Technology and Innovations in the NEMT Industry Will Make it More Productive
- Conclusion
NEMT Is the Fastest-Growing Patient Transport Segment in Medical Transportation
According to 360iResearch Global Forecast, in 2026 the global NEMT market size has reached USD 18.19 billion. Over the six-year forecast horizon ending in 2032, the market is projected to expand its valuation to USD 25.43 billion.
NEMT is the fastest-growing segment of all medical transportation industries. Researchers predict a compound annual growth rate (CAGR) of 5.52% during the period from 2026 to 2032.
These factors from the non-emergency medical transportation statistics represent numerous opportunities for NEMT businesses to make money by entering new markets as well as get more NEMT contracts and trips.
NEMT Services Are Important for Positive Healthcare Outcomes of Patients
Nowadays, hospitals and other healthcare facilities face difficulties related to managing growing patient volumes. As of 2026, older adults (who are the most frequent NEMT users) outnumber children in 11 states, and according to the latest projections by the Census Bureau, by 2034, seniors will outnumber children across the country.
Due to these numbers, NEMT keeps developing and growing because the healthcare industry realizes the direct correlation between transportation availability and positive healthcare outcomes. According to a Wolfe, McDonald, and Holmes study, an estimated 5.8 million Americans delayed medical care due to a lack of transportation. As we know, delayed medical care can result in worse symptoms and severely affect patients' quality of life. In addition, it leads to an increased need for preventative hospitalizations or emergency care.
Missed appointments cost the U.S. healthcare system an estimated $150 billion per year. A Robert Wood Johnson Foundation and Urban Institute study found that 21% of U.S. adults without access to a vehicle or public transit skipped needed medical care in the past year – a figure that drops to 9% for those with public transportation access.
To sum up, according to studies and medical providers’ experience, NEMT is an invaluable part of the healthcare ecosystem.
The Financial Case for NEMT: Costs, Savings, and ROI
NEMT is not just a cost; it is a cost-saving intervention when measured against the alternatives.
- Missed appointments cost the U.S. healthcare system an estimated $150 billion per year, with each missed slot costing an average of $200–$265.
- NEMT use results in an average monthly savings of $1,300 per person for patients who maintain prescribed treatment schedules.
- NEMT has been deemed cost-effective or cost-saving for all 12 medical conditions analyzed in the TCRP literature, including prenatal care, asthma, heart disease, diabetes, and ESRD.
The United States NEMT Market Landscape
The United States represents the largest and most mature regional market for NEMT, accounting for approximately 41.2% to 45% of global revenue (Mordor Intelligence reports North America at 41.23%).
|
US Market Metric |
2024–2025 Value (USD) |
2030–2031 Projection (USD) |
Growth Rate (CAGR) |
|
US NEMT Market Size |
4.4B – 6.6B (Business Market Insights) |
10.25B – 13.44B |
8.0% – 9.3% |
|
Medicaid NEMT Spending (FFS only) |
~3.0B+ |
– |
~7% |
|
Managed Care Segment |
1.8B – 2.2B |
3.8B – 4.2B |
10.04% |
|
Private Pay Patient Trans. |
1.1B – 1.4B |
2.5B – 2.8B |
9.5% |
The U.S. NEMT dominance is largely a product of the complex American healthcare payer system and the statutory mandate for transportation within the Medicaid program, which dates back to the program's inception in 1965.
How Many People Are Eligible vs. How Many Actually Use NEMT
When it comes to benefits, eligibility and use are not the same thing. Here are the details on the utilization of Medicaid and Medicare benefits across the nation.
Medicaid NEMT Utilization
The eligibility base is massive: in October 2025, CMS reported 76.79M people enrolled in Medicaid and CHIP across the 50 states + DC (69.5M in Medicaid, 7.2M in CHIP – confirmed by KFF).
But national Medicaid utilization data (claims/encounters) shows that only a fraction of the eligible population use NEMT in a given year. In MACPAC's analysis of Medicaid NEMT, the utilization rate was reaching only ~5%, which is about 3–4 million users yearly. Alaska, Minnesota, Arizona, Maine, and Wisconsin had the highest utilization rates, with up to nearly 11% in Alaska in 2021.
Note: Enrollment has dropped significantly since the pandemic peak. Medicaid/CHIP enrollment fell from a record 94.1 million (April 2023) to 76.8 million (October 2025) due to the unwinding of pandemic-era continuous enrollment.
Medicare Advantage: transportation as a supplemental benefit (and its current contraction)
NEMT isn't only a Medicaid story. Medicare Advantage (MA) plans (which enrolled more than 34 million beneficiaries (54% of eligible Medicare population) in 2025) can offer transportation as a supplemental benefit, though, unlike Medicaid, it is not a mandatory coverage requirement.
According to KFF's analysis of CMS Landscape and Benefit files (January 2026), transportation availability is declining across the board:
Individual MA plans offering transportation for medical needs:
|
Year |
2022 |
2023 |
2024 |
2025 |
2026 |
|
% of Plans Offering the Transportation Benefit |
39% |
43% |
36% |
30% |
24% |
Special Needs Plans (SNPs) offering transportation for medical needs:
|
Year |
2022 |
2023 |
2024 |
2025 |
2026 |
|
% of Plans Offering the Transportation Benefit |
87% |
88% |
88% |
81% |
67% |
NOTE: Medicare transportation benefits expanded rapidly during the COVID era as plans competed on supplemental benefits and supported access during lockdowns. The current contraction likely reflects post-pandemic recalibration, regulatory tightening, and increased margin pressure within Medicare Advantage rather than a collapse in transportation demand.
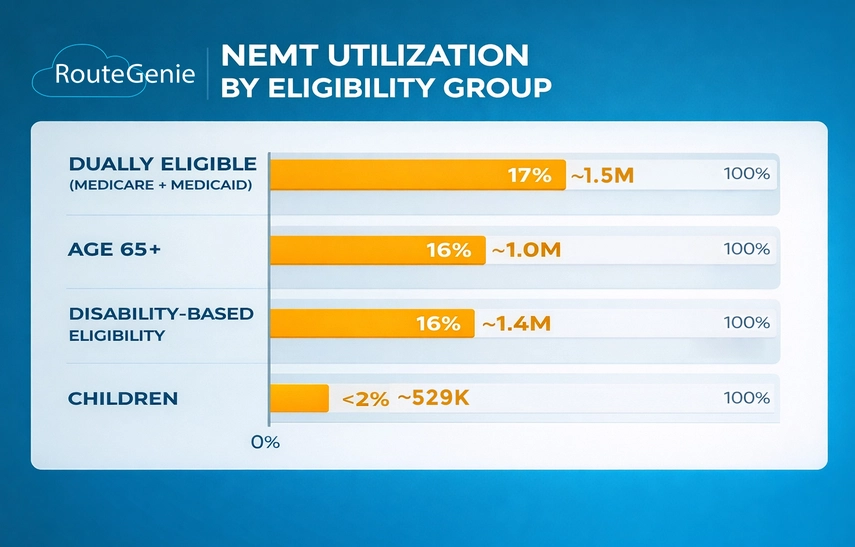
Who Uses NEMT Most (Ages, Disability, and High-Need Conditions)
NEMT use is highly concentrated among older and higher-need groups. In MACPAC's Medicaid data:
|
Eligibility Group |
NEMT Utilization Rate |
Est. Users |
|
Dually eligible (Medicare + Medicaid) |
~17% |
~1.5M |
|
Age 65+ |
~16% |
~1.0M |
|
Disability-based eligibility |
~16% |
~1.4M |
|
Children |
<2% |
~529K |
Frequency matters as much as prevalence. Among NEMT users, CMS reports average monthly ride-days of:
- 4.0 – PACE enrollees
- 3.5 – 1915(c) waiver enrollees
- 2.6 – disability-eligible beneficiaries
- 1.8 – age 65+ beneficiaries
- <1.0 – pediatric users
Clinical conditions sharply increase NEMT intensity. CMS reports especially high NEMT use among people with ESRD (dialysis-related need), and elevated use among beneficiaries with OUD and other substance use disorders.
Where Do Rides "Go"?
Dialysis and Oncology: The High-Frequency Core
Dialysis remains the single largest application for NEMT services, representing 29.42% of total market demand. Dialysis patients use NEMT nearly 6 days per month on average. Patients with end-stage renal disease (ESRD) typically require three round-trips per week, providing a stable, predictable volume of "anchor rides" for transportation providers. Similarly, chemotherapy and radiation sessions are high-priority applications that rely on NEMT to ensure treatment adherence and prevent the progression of disease.
Behavioral Health and Rehabilitation Expansion
The fastest-growing application segment is mental health and behavioral health transportation, which is projected to grow at a CAGR of 9.55% to 10.11% through 2031. This growth is driven by state-level mental health parity requirements and the integration of behavioral health into primary care models.
|
Application Segment |
Market Share (2025) |
Expected Growth (CAGR) |
Clinical Importance |
|
Dialysis |
29.42% |
5.0% |
Life-Sustaining Care |
|
Mental Health |
12% – 15% |
10.11% |
Compliance; Crisis Prev. |
|
Routine Doctor Visits |
20% – 25% |
4.2% |
Preventive Maintenance |
|
Rehab & Physical Therapy |
10% |
9.0% |
Post-Surgical Outcomes |
Rural vs. Urban NEMT Disparities
NEMT utilization is roughly similar in urban and rural areas (~4–5%), but service quality and availability differ sharply (MACPAC):
- Rural areas face acute vehicle supply shortages, especially for wheelchair vans and stretcher vehicles. Several MACPAC interviewees noted limited availability of specialized vehicles as a key network adequacy challenge.
- Average trip distances are significantly longer in rural areas, increasing per-trip cost and reducing vehicles' daily trip capacity.
- While Maryland has the lowest NEMT utilization of around 1%, Alaska had the highest NEMT utilization at nearly 11% of Medicaid beneficiaries (2021), reflecting extreme rural transportation barriers.
Who is Paying for NEMT
|
Payer Source |
2025 Market Share |
Expected 2026–2032 Trend |
|
Medicaid (Total, incl. MCO-delivered) |
52% |
Stable; shift to MCO delivery |
|
Medicare (incl. Advantage) |
9%–15% |
Moderate pullback in 2026 |
| Managed Care Organizations | 10–22% |
High Growth (10%+ CAGR) |
| Private Pay (Out-of-Pocket) | 8%–12% |
High Growth (9.3%+ CAGR) |
|
Private Insurance |
5%–10% |
High Growth |
Note: In many industry reports, "Managed Care (MCO) Contracts" are listed as a separate 22–28% category. However, most Medicaid NEMT is now delivered through MCOs or brokers rather than fee-for-service, so the Medicaid and MCO categories substantially overlap. Brokers manage roughly 70% of all Medicaid transportation trips in the United States.
NEMT Mode Split: Ambulatory vs Wheelchair vs Stretcher
National Medicaid data often reports modes like "van" or "taxi" (and explicitly notes that wheelchair and stretcher vehicles may be embedded in the "van" category). MACPAC's mode analysis.
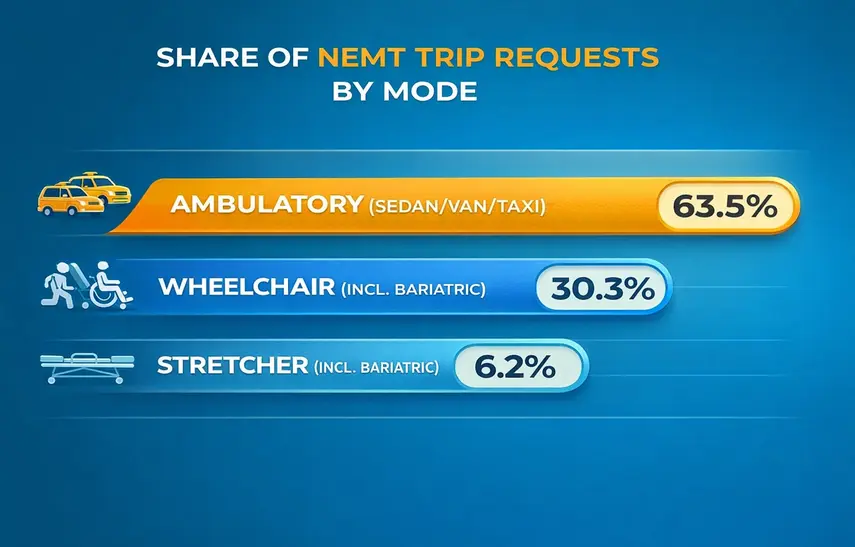
To get a clean ambulatory vs wheelchair vs stretcher picture, state-level data is more useful. The most widely-cited breakdown comes from the Burns & Associates Independent Review of Indiana Medicaid FFS NEMT:
- Ambulatory (sedan/van/taxi): 63.5%
- Wheelchair (incl. bariatric): 30.3%
- Stretcher (incl. bariatric): 6.2%
This split is corroborated by other state data. Virginia's JLARC analysis found that 81% of trips used taxis, vans, or public transportation, while 19% required an ambulance or wheelchair van – consistent with an ambulatory-dominant pattern.
What NEMT Management Models Do States Use?
State Medicaid agencies employ four primary models for NEMT delivery (CCAM-TAC State Profiles):
- Directly Operated: Used by 7 states (14%), including Alaska, Montana, and Wyoming.
- Regional Transportation Brokers: Used by 11 states (22%), including Georgia, Massachusetts, and Washington.
- Statewide Transportation Brokers: Used by 12 states (23%), including Connecticut, New Jersey, and New York.
- Mixed Models: Used by 21 states (41%), which combine direct operation with MCO-contracted brokers, including California, Florida, and Texas.
The brokerage model is the most common nationally, established as a state option under the Deficit Reduction Act of 2005. Over 40 states now use brokers or MCOs to administer NEMT. The market is dominated by a handful of major national brokers: ModivCare (formerly LogistiCare), MTM/Veyo, Access2Care, and Southeastrans.
Diffusion of Technology and Innovations in the NEMT Industry Will Make it More Productive
Individuals miss appointments because of the time gap between scheduling and healthcare appointments. Memory may decline in seniors, that’s why various technologies, e.g., reminders, are very helpful since they reduce cancellations. Due to NEMT scheduling software or customer applications, passengers can schedule up to 30 days beforehand, and no reminder phone calls are required.
The Affordable Care Act encourages hospitals to lessen patients’ readmission, and non-emergency medical transportation companies that use the NEMT billing software, provide more opportunities for medical appointments and preventative care. Modernized NEMT delivery can save an estimated $268 per expected user per year and $537 million annually when scaled nationally.
All in all, NEMT providers are essential members of the care delivery team and can improve outcomes by equipping patients with modern scheduling and communication tools to manage cancellations or no-shows.
All the above-mentioned studies, programs, and regulations indicate that the use of modern technologies by the NEMT providers is key to improving healthcare transportation and patient satisfaction. In the long run, it’s important for enhanced healthcare goals.
Conclusion
As we can understand from NEMT stats, this type of transportation is time-tested and efficient for patients and the medical care system. However, there is room for improvement. If NEMT operations are processed manually, it requires lots of paperwork, phone calls or emails, etc. This leads to slow workflow, errors, and results in costly delays or no-shows for both providers and patients.
To perform efficiently and stay competitive, modern Non-emergency transportation companies should consider a high-quality, intelligent NEMT routing software solution. One of the best recommendations in today’s market is RouteGenie NEMT software. It is a tried-and-trusted solution that manages all transportation and communications logistics through one dashboard in an automated manner.
Try RouteGenie software today, it may be the missing piece you need to operate even more successfully!
About the author

As RouteGenie's Marketing Director, Yurii gained deep knowledge in the NEMT industry. He is an expert in marketing, leveraging all channels to build RouteGenie's brand and ensure NEMT providers have access to powerful NEMT software that can boost their growth. Yurii shares his knowledge by writing content on marketing and healthcare topics, including medical transportation, home care, and medical billing.